But the truth is that many new forex/Stock traders still get it wrong when it comes to trading support and resistance levels because they do not understand some of these 7 interesting facts I’m going to mention here.
These can help you in your trading…
#1: Obvious Factor
Every support and resistance level on any chart must be VERY obvious.
Which means they stick out, stand out, whatever you may call it.
In simple terms, support and resistance levels should stick out like a bull’s balls:
If you are unsure if a level you see is a S&R level or not, then get back to what I said before ask yourself this question: is it really obvious?
If you can’t see it, thousands of traders all over the world can’t see it. Which means don’t bother with such price levels.
#2: Each Timeframe Has Its Own Support And Resistance Levels
Each timeframe has its own support and resistance levels.
Larger timeframes cover up the smaller support and resistance levels found in much smaller timeframes.
Here is an example of what I’m talking about showing obvious support and resistance levels in the daily timeframe on EURJPY chart:
Now, this chart below is the same chart of above but in the 4hr timeframe and notice that in the 4hr timeframe, you also have 4hr timeframe support and resistance levels:
When you are trading support and resistance levels in the smaller timeframes, you should also be aware of how far away price is to the major support and resistance levels found in the larger timeframes.
Why?
Support and resistance levels in larger timeframes are major trend changers!
That’s why!
#3: Support And Resistance Levels Are Zones
A support or resistance level is not just a line drawn on the chart highlighting one specific price level.
Support and resistance levels must be considered as jones.
Why?
Well, have you ever been in a situation where price just comes down to a support level and but not really touching it and then shoots up?
Chances are, the area where price shot up was a support zone…price could have shot up anywhere withing that support zone.
Just because you were focused on one price level, you missed this trade.
Support and resistance level zones can vary from a few pips up to 100 pips and that really depends on the timeframe you are seeing it in.
For larger timefrme, there will be a quite a huge range for this support/resistance zone.
#4: TREND CHANGERS
Support and resistance levels are trend changers.
Every time, price goes to a support level, you should expect that an uptrend may be forming soon.
Every time price goes to a resistance level, you should expect that a downtrend may be forming soon.
Support levels are demand levels
Resistance levels are supply levels.
When price heads to support and resistance levels, the demand and supply changes.
Ok, this is not a difficult concept to understand.
What happens at support levels? Lots of buying power comes in, right? So what happens to price? It shoots up. Right.
In a resistance level, the opposite happens. Demand weakens and there’s an oversupply. What happens if there’s an oversupply?
Price drops.
#5: Trading Support And Resistance Levels In Larger time Frames Offer The Best Risk:Reward Outcomes
Again, this is so obvious.
Go open up your chart and look at a past support or resistance level and imagine what would have happened if you bought at the support level and held your trade for 15 or more days?
Did price move 700 pips? 1000 pips?
Let’s look at a “what if” scenario.
Trader Joe Blow saw this major support level/zone and took a buy trade.
His stop loss was only 40 pips.
His take profit target was the obvious resistance level above.
About 2 months later, his profit target was hit, giving him 400 pips profit.
His risk:reward=1:10. Awesome trade outcome, in my opinion.
Now, this example above is for trading support and resistance on larger timeframes but even in in smaller timeframes, the risk:reward of trading support and resistance levels there are pretty much going to be the same.
#6: Roles Change/Reversal
This is when a previous support level becomes a resistance levels and a previous resistance level becomes are support level.
When a major support or resistance levels get broken and price moves away from it, don’t be fooled…
One day, price may head back to the broken level and guess what will happen?
Roles may reverse so it is not truly over yet so don’t forget that.
#7: Time Matters
How far away in the past should you go looking for support and resistance levels?
It depends on your trading style/technique and the timeframe you are using to trade.
For my case, I use
multiple timeframe trading a lot and therefore it is important for me to do top down
technical analysis from the monthly charts down to the 1hr timeframe to identify where the major support and resistance levels are including trendlines, price channels etc and I have lines drawn up on my charts there to remind me should price ever come close to those levels.
But here’s the thing: the more recent support and resistance level has a much greater significance than those that have been formed “millions of years ago”.
Why is this so?
Well, because what happened in the past may not be easily view able on the trading platform that many traders are using, which means you have to really switch to a much larger timeframe or minimize your zoom out to see what happened in the past.
When trading, put a lot more focus on the recent support and resistance levels.
If there are no recent support and resistance levels then start expanding by going out further into the past to see if you can find support and resistance levels there.
SUMMARY
So there you have it. Trading support and resistance levels first starts with you knowing which are the best levels to pick.
It may take a while if you are new but over time, it just becomes second nature.

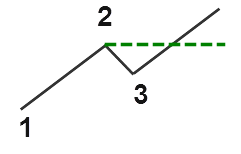


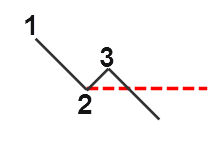
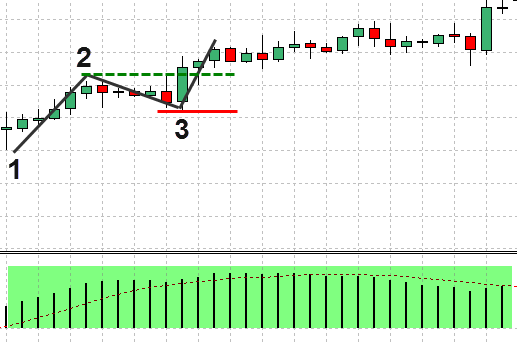
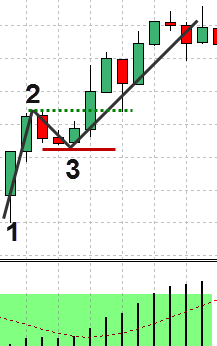
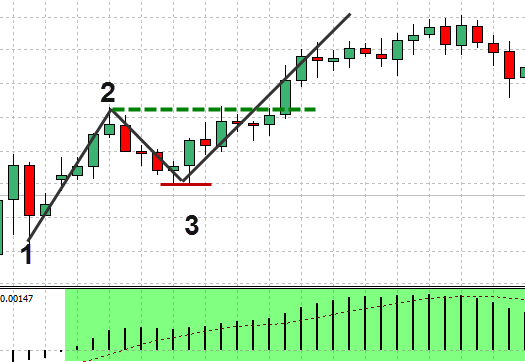
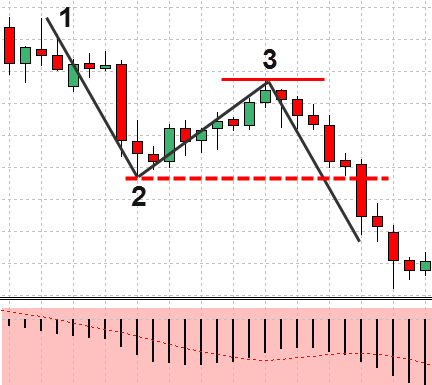
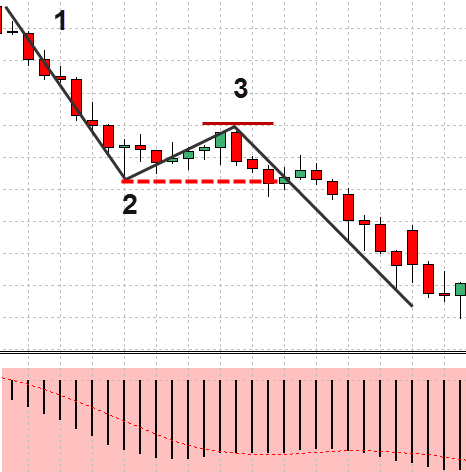
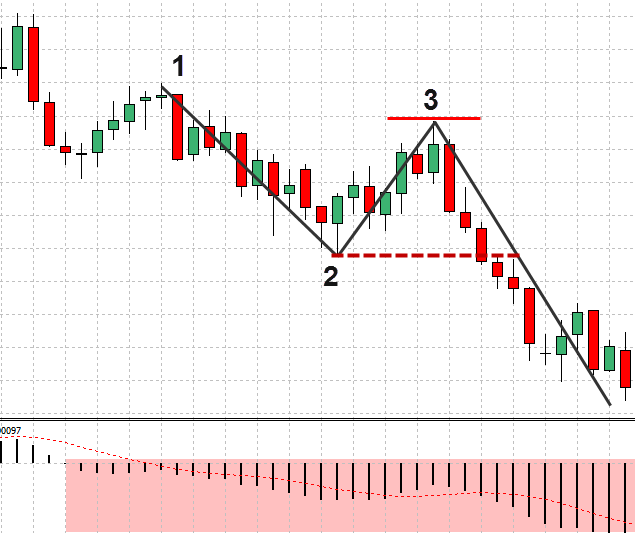
 Apply the 1-2-3 pattern.