Powered by Blogger.

Pages

Sunday, December 30, 2018

REVERSAL BAR PATTERN

REVERSAL BAR PATTERN

What does it look like?
A bullish reversal bar pattern goes below the low of the previous bar before closing higher.
A bearish reversal bar pattern goes above the high of the last bar before closing lower.
Reversal Bar Pattern
What does it mean?
For the bullish pattern, the market found support below the low of the previous bar. Not only that, the support was strong enough to push the bar to close higher than the previous bar. This is the first sign of a possible bullish reversal.
For the bearish pattern, the market met resistance above the high of the previous bar. Furthermore, the resistance was powerful enough to cause the current bar to close lower.
How do we trade it?
  1. Buy above the bullish reversal bar in an uptrend
  2. Sell below the bearish reversal bar in a downtrend
Reversal Bar Pattern Trading Example


Wednesday, December 12, 2018

The Best Stocks to Buy Now or Whenever

best shares to purchase
Table of Contents
This article is aimed for people that are interested in making money in the stock market for the longer haul. What I am going to do, is teach you the best system for finding best stocks to buy now or whenever in the future.
The whole aim of this brief, yet super useful article is to give you the best fishing rod out there and teach you how to fish without much effort. If you are interested in learning a small system that can earn you 20% per year returns on average, beating 90% of fund managers, then I suggest you keep on reading.

Value investing – the Most Effective Way to Grow Your Capital

stock market investing

One of the greatest minds in the value investment school of though is Warren Buffet and he has the perfect explanation for what this strategy consists of – „Value investing is buying a dollar for 50 cents“. And that’s exactly what it is.
In reality, what this practice involves is trying to find companies that are sold at a bargain. Value investors are looking through different company’s balance sheets all day to try and make a guestimation regarding what they could be worth and compare it to the current stock price. If something seems to be sold for a lot less than the investor thinks it is worth, they make a purchase.
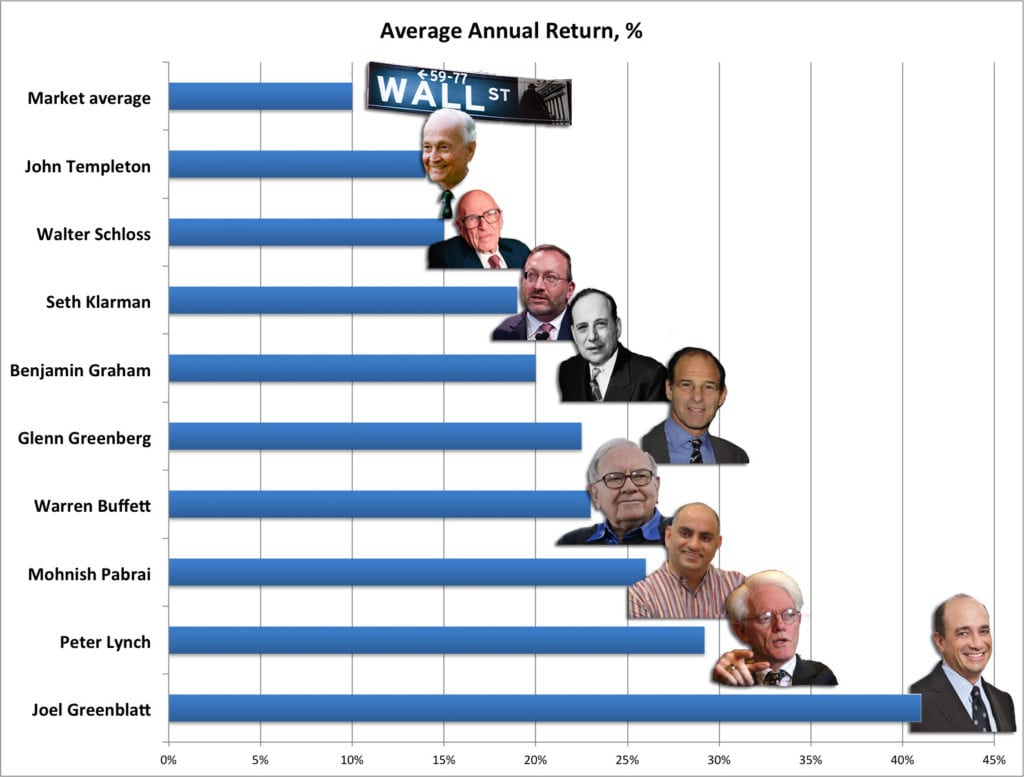
This is the daily practice of many great investors that have been able to beat the market for a great number of years. Below you’ll find a graph comparing some of the famous value investors to market average return per year.
best stocks to buy now

What does it mean for you?

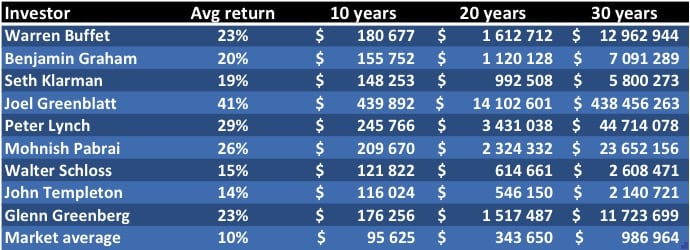
That’s great for those gazillionaires, but how does this concern me – you might wonder. Let’s check how much you would make in 10, 20 and 30 years if you were to invest 500 every month following the same strategies as the fellas shown above.
swing
The above table gives us an overview of how much money you would have in a the case of 10-30 years provided that you invest 500 $a month, if you are able to invest more, just multiply the sums.
Joel Greenblatt’s results are insane. This is super hard to achieve and I would not recommend trying to achieve that, but it perfectly illustrates what is possible.
This example is just to give you a rough idea of what is possible. In 3 years, if you are able to beat the market 2 times (which half the investors there have achieved), you’ll overall return in 30 years is not 2 times greater, but 7 times.
This shows the power of compound interest combined with market beating investing strategy. With that you can achieve millionaire status from your day job and not having to do too much. All you need is persitency and a little bit of excess cash every month, but it can help you retire a lot sooner than the official retirement age.

The Fishing Rod

Now that I’ve told you why you should learn to fish, I’m going to introduce you to a system that rather easily ables you to earn above 20% annual returns on average.
One of the star value investors outlined above was Joel Greenblatt. He was the one that achieved 41% p.a. returns for 19 consecutive years. The minimum levels required to invest with his funds are too high for the average investor. Average investment size minimums start from millions, and that is not where most people are at.
In order to reach these incredible numbers yourself, you would need to roll up your sleeves and work long hours reading and researching different companies, doing industry research and following macro trends.
This is all too much for the average bloke and Joel Greenblatt has addressed this issue. He has written a book called “The Magic Formula”. I highly suggest you read it. The book is written in order that his kids would understand it. You won’t find any sophisticated financial terms from there, just a straight to the point system on how the average Joe can reach really good returns in the stock market.

witches-wizards-4611

So what’s the magic formula?

Despite the name, there is no magic of fluff involved. It’s a straightforward mathematical formula based on two quantitative equations. Greenblatt’s system is based on looking at
  1. How much the company is worth based on its’ earnings (P/E) ratio.
  2. How much money does it make for the invested capital.
So in brief, the company needs to be highly profitable and it should be cheap to buy its stocks. That’s it! This will result you a list of best stocks to buy for your portfolio.
The way the formula works is that you take a market that you are interested in. Take all the stocks that have a decent enough capitalization (to make sure they are established companies, not some start-ups), weed out the sectors that are more risky than others (eg. Finance) and rate all the stocks based on the two criteria.

Sounds complicated? Greenblatt actually does all this for you.

Joel is actually a pretty decent guy. In addition to his book, he has made a website that does all the calculation for you and the result is 30-50 companies that the formula recommends. In back-testing this system, he found out that the average return for the system was 22% per annum. That’s more than 95% of hedge fund managers are able to make you and they charge a hefty fee.
All you need to do is buy a minimum of 30 companies from the list, hold them for a year and replace the companies with new ones from the list. The list of companies gets updated frequently and in each year, you get a list of new companies (although some may remain).
The website can be found from http://www.magicformulainvesting.com from there you can actually find a list of best stocks to buy at all times – as stated in the topic of this article.
Whenever you start with this, the list is always updated and presents you with the list of best stocks from the US market to invest in based on value investing principles of Joel Greenblatt. I personally use this method to invest majority of my long term portfolio. I have been using it for 6 years and the average annual return has been 28% after brokerage costs.

Brief Conclusion

This is the best method out there to find best stocks to invest in for your long term investment portfolio. It is back-tested and based on solid value investment principles. You will experience losses with the system throughout the years, but on average, it is expected to beat majority of systems and professional fund managers with 100s and 1000s of analysts working for them.
If you are really interested, I highly suggest to read the whole book to get a better understanding of the system and the principles this strategy is based on.
Investing for the long term is something that you need to start with ASAP. No excuses, start with as little as you can, the more time you have, the more you’ll end up with.
warren buffet

That’s it!

Leave a comment if you have any questions, experiences or counterarguments to this article. I’d be more than happy to answer.

Swing Trading Strategies – The Ultimate Guide

Interested in trading part time and still making decent profits? Then this swing trading strategy guide is for you.

Swing trading is a perfect option for people that don’t have all day to concentrate on trading. It’s for people that work full time/study or just want to do other things with the majority of their day. In this article I’m going to share my very best swing trading strategy.
Usually the case is that the more you work the more you make. This is true of course, although with swing trading it is possible to achieve enviable profits with just 1-2 hours of “work” per day.
I invite you to read through this simple guide on a very effective technique on how to practice swing trading on your own.
This guide rather short and written in a very easy-to-read format and is meant for people with low to medium level of experience in the markets

What is Swing Trading in the First Place?
a man thinking

Swing trading attempts to capture gains in a stock (or any financial instrument) within an overnight hold to several weeks.
Swing traders use technical analysis to look for stocks with short-term price momentum.
These traders may utilize fundamental or intrinsic value of stocks in addition to analysing the price trends and patterns. – Explanation taken from Investopedia.
In my own words:  Swing trading is looking for certain price patterns that are predictable and trying to profit from them.
As the graphs that are monitored are multiple day to weekly charts, the trades take time to play out meaning you don’t need to monitor the trades for the whole day.
You analyse the charts when you have time, put in orders, set automatic stop-loss and profit orders and move on to your other activities.
STEP #1
Finding Diamonds – Profitable Patterns to Search For
a man with a diamondNow as you have your account all set up and you’re ready for action, let’s go and find some diamonds for ourselves.
What I mean by diamonds is price patterns of stocks/ currencies/ commodities that occur often and thus are predictable.
With these patterns you are able to forecast what they are likely to do in the future and profit from it more times than not.
Below you’ll find an overview of my favourite swing trading patterns ranked by my own success ratio with them:

#1 Triangle

triangles chart pattern
Triangle shape is in my experience one of the best working patterns in terms of chances of success. You may find it in many forms, either ascending like the one on the picture, descending or even asymmetrical.

#2 Double Top

double tops
Double top is another great pattern that is well known among traders and yet works with a rather high success ratio. The same pattern works vice versa, if you notice one upside down, you can utilise it for going long in a stock.
Again, I’m not going to go into depth with this pattern, as someone else has already done a great job at that, which is why I advise you to check out Finvids double top section.

#3 Channel Pattern

channel pattern
This is one of my favourite patterns, despite it having less chance of success as the ones named above. I like the pattern, because it can be found very often in various instruments. This pattern can be a great moneymaker if utilised correctly.
There are two main ways to trade this pattern, one is within the channel and the other is to trade breakouts. Both are explained on the below video. Also again I advise to read Finvids channels section again if you want to learn a bit more about the specifics of the pattern.

Saturday, December 8, 2018

Here’s What Will Happen If You Practice One Trading Strategy 10,000 Times

Besides a little bit of luck both mentally and physically, the best professional athletes, business people and traders all have two things in common that have made the biggest contribution to their success…
Those 2 things are:
  1. Habitual practice of the processes and (or) concepts that will bring them closer to their end-goal / success.
  2. Complete discipline and focus on the task at hand until TOTAL mastery is reached. Then, they work to maintain it and add more ‘weapons’ to their arsenal.

This article is going to discuss how and why you should narrow your focus in trading, so that you are eliminating variables and truly perfecting your craft. The people who make the most money in this world all have one thing in common: they are VERY GOOD at a small amount of things or even just one thing. Ever heard the saying “Jack of all trades, master of none”? Think about that for a minute because it’s true and especially so in trading. The consequences for not becoming a “master” of your trading strategy are severe, whereas in other professions that may not be so.
You need to read this article, all of it, so that you truly learn why you need to practice one trading strategy “10,000” times and also, so that you learn how to do it. This lesson, if properly comprehended and implemented, has the power to transform your trading from losing or breaking even, to winning. The following Bruce Lee quote was the inspiration for today’s lesson:
“I fear not the man who has practiced 10,000 kicks once, but I fear the man who has practiced one kick, 10,000 times.” – Bruce Lee

Spring at Support & Resistance

A spring is when a stock tests the low of a range, only to quickly come back into the trading zone and kick off a new trend.  I like to use volume when confirming a spring; however, the focus of this article is to explore price action strategies, so we will zone in on the candlesticks.
The one common misinterpretation of springs is traders wait for the last swing low to be breached.  Just to be clear, a spring can occur if the stock comes within 1% to 2% of the swing low.
Trading setups rarely fit your exact requirement, so there is no point in obsessing a few cents.  To illustrate this point, please have a look at the below example of a spring setup.


Wednesday, November 7, 2018

Happy Diwali (2018)


Let the festival of lights fill your life 
with positivity wishing you
Happy Diwali and Prosperous New Year

Saturday, November 3, 2018

Price Action Strategy Using Moving Average & Candlestick


The price action strategy trading is most simple yet powerful stock market strategy you’ll ever find.

Timeframes : 15 Minute
Pairs : Indian Stock (Future Script)
Indicators: Moving Average(SMA,20)
Chart: Candlestick, Bar chart

For Buying 
candle should be Open=low
candle opening should be below of Moving average(20,SMA)
and close price should be above moving average(20,SMA) line

Trade setup
Entry Point: once candle high break then go for Buy
Stoploss: Candle Low keep stoploss
Target: 1% of Scrip or keep Candle High low difference or
best way keep trailing stoploss once 1% target achieved

Example mentioned below


For Selling 

First identify Conditions for Selling
candle should be Open=High
candle opening should be above of Moving average(20,SMA)
and close price should be below moving average(20,SMA) line

Trade setup
Entry Point: once candle Low break then go for Sell
Stoploss: Candle High keep stoploss
Target: 1% of Scrip or keep Candle High low difference or 

best way keep trailing stoploss once 1% target achieved


Saturday, October 27, 2018

Nifty Formed Inverted Cup & Handle Pattern


As its name implies, there are two parts to the pattern: the cup and the handle. The cup forms after an advance and looks like a bowl or rounding bottom or Top  or . As the cup is completed, a trading range develops on the right-hand side and the handle is formed. A subsequent breakout from the handle's trading range signals a continuation of the prior advance.


  1. Trend: To qualify as a continuation pattern, a prior trend should exist. Ideally, the trend should be a few months old and not too mature. The more mature the trend, the less chance that the pattern marks a continuation or the less upside potential.
  2. Cup: The cup should be “U” shaped and resemble a bowl or rounding bottom. A “V” shaped bottom would be considered too sharp of a reversal to qualify. The softer “U” shape ensures that the cup is a consolidation pattern with valid support at the bottom of the “U”. The perfect pattern would have equal highs on both sides of the cup, but this is not always the case.
  3. Cup Depth: Ideally, the depth of the cup should retrace 1/3 or less of the previous advance. However, with volatile markets and over-reactions, the retracement could range from 1/3 to 1/2. In extreme situations, the maximum retracement could be 2/3, which conforms with Dow Theory.
  4. Handle: After the high forms on the right side of the cup, there is a pullback that forms the handle. Sometimes this handle resembles a flag or pennant that slopes downward, other times it is just a short pullback. The handle represents the final consolidation/pullback before the big breakout and can retrace up to 1/3 of the cup's advance, but usually not more. The smaller the retracement, the more bullish the formation and significant the breakout. Sometimes it is prudent to wait for a break above the resistance line established by the highs of the cup.
  5. Duration: The cup can extend from 1 to 6 months, sometimes longer on weekly charts. The handle can be from 1 week to many weeks and ideally completes within 1-4 weeks.
  6. Volume: There should be a substantial increase in volume on the breakout above the handle's resistance.
  7. Target: The projected advance after breakout can be estimated by measuring the distance from the right peak of the cup to the bottom of the cup.

Saturday, September 29, 2018

1-2-3 Strategy – Price Action Strategy

The forex 1-2-3 price action pattern trading is most simple yet powerful forex strategy you’ll ever find.

Question: When to use Forex 1-2-3 Price Action Pattern?

Answer: It works for any time.

The 1-2-3 pattern work best when the patterns follow the direction of trend (it also works against the trend). The pattern is also easy to identify on the chart and you can find it every day.


forex-1-2-3-strategy-price-action-1

We’re going to use MACD indicator as a combination to filter bad trades.

The basics of MACD:


forex-1-2-3-strategy-price-action-2

When the histogram flips up, then look for buy only.

forex-1-2-3-strategy-price-action-3

When the histogram flips down, then look for sell only.


The Forex 1-2-3 Strategy Method:

The 1-2-3 pattern in an uptrend


forex-1-2-3-strategy-price-action-4

1.Existing trend

2.Higher high

3.Higher Low

***Break out of 2 (green line), results in strong continuation of price to up direction.

The 1-2-3 pattern on downtrend


forex-1-2-3-strategy-price-action-5

1.Existing trend

2.Lower Low

3.Lower High

***Break out of 2(red line), results in strong continuation of price to down direction.

It’s not that complicated to learn this pattern. It takes a while to recognize and remember the pattern.

The setup divided into two parts:

Buy Setup

Sell Setup

The buy setup:

Make sure the MACD histogram is flipping up

forex-1-2-3-strategy-price-action-6Apply the 1-2-3 pattern.

forex-1-2-3-strategy-price-action-7

Set a pending order just 1-3 pip above the 2

Stop loss on 3

More Examples for buy setup:


forex-1-2-3-strategy-price-action-8
forex-1-2-3-strategy-price-action-9


The Sell Setup:

Make sure the MACD histogram is flipping down.

forex-1-2-3-strategy-price-action-10

Apply the 1-2-3 pattern.

forex-1-2-3-strategy-price-action-11

Set a pending order just 1-3 pip below/on the 2

  • Stop loss on 3

  • More Examples

forex-1-2-3-strategy-price-action-12
forex-1-2-3-strategy-price-action-13

Profit Target discussion:

Count the pip range of A. Most of time, the Length of A=B. If the A=60 pip. B is also 60 pip.


forex-1-2-3-strategy-price-action-14