Price action trading is a place every Forex trader needs to “go to” at some point in their Forex journey (the sooner the better).
It dramatically helps with spotting quality trade signals, improving decision making, and strengthening your risk analysis.
Most Forex trading systems are built off the premise that YOU (the trader) possess a price action trading skill set to be able to make these systems work for you!
Who needs drugs when you’ve got price action trading… it’s that good 😀 That’s why I’ve dedicated my trading career to it and have over 10 years experience trading with it.
So, if you’re not into price action trading – what is going on with you!? Time for you to learn the skill (and science) of reading the price action, exploit it’s secrets, and become a master chart reader.
Forex traders using price action trading are usually clever people, and technically wired into what’s going on.
However, I feel like many in the industry are frustrated with their price action trading progress, due to a few small “traps” that most don’t realize they are stuck in.
In this tutorial – I am going to share with you 4 massive price action trading tips for getting out of the depressive candlestick “grind”, and help free you from the “stuck in the mud” situation.
Price Action Trading Tip #1: Stop Trading Candlestick Patterns
Wait what?
Candlestick patterns are viewed as the money making mascots of price action trading!!! :O why would we ditch them? Spoiler alert: We don’t, but we’ve gotta make some changes…
The most common trap for price action traders is trading candlestick patterns ONLY – absent of any other kind of analysis.
Candlestick patterns are great, some work better than others, however… if they are your only reason for entering a trade, you will fall into a very frustrating grind – because they really do not have much of an edge in the markets when isolated.
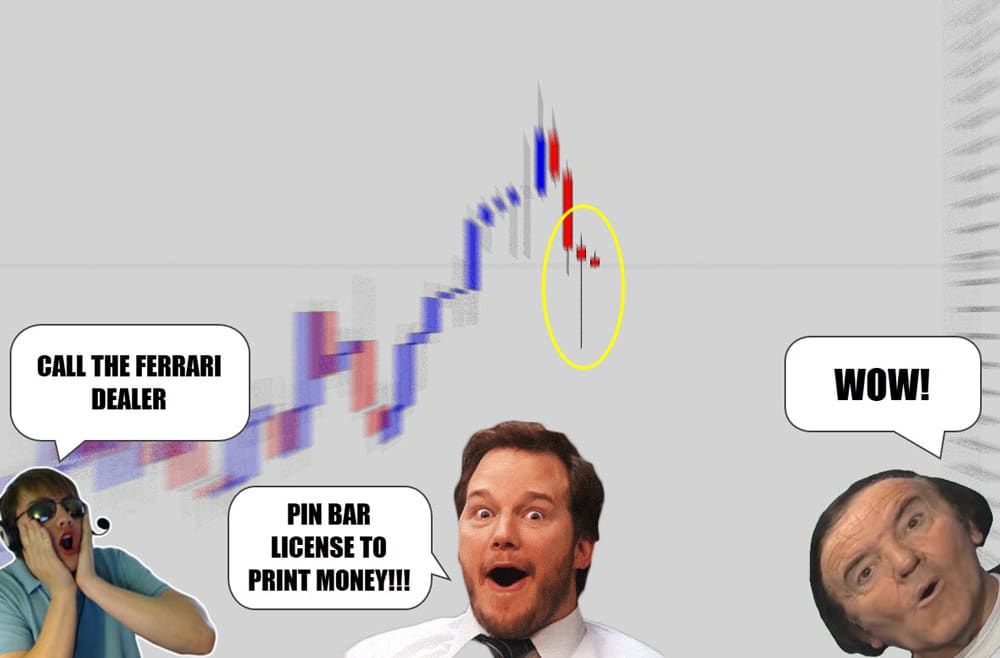
This is how I see a lot of price action traders react to certain candle pattern signals…
Everyone knows about candlestick patterns, every price action trader at their computer right now is looking for them – but you know the statistics, not many traders can keep their account balance from disintegrating.
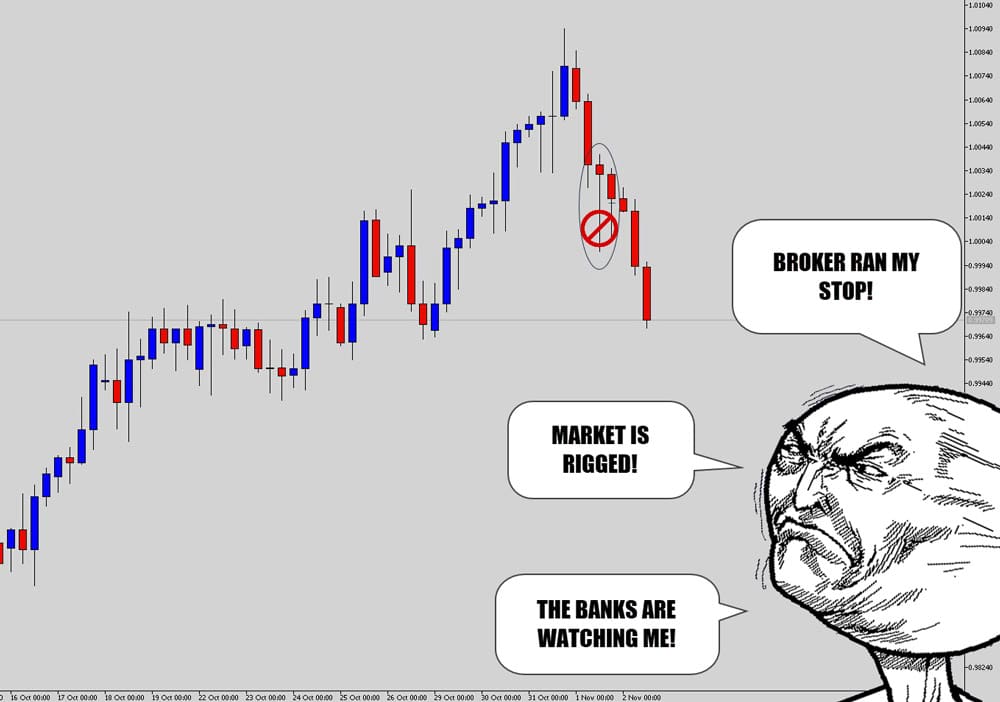
Above: Some of the comical comments I’ve seen traders make after being stopped out… not taking any accountability for their decisions.
If you run simulations by coding a price action trading program to open trades when specific candlestick patterns print – it either destroys the account in a baptism of fire, or just grinds sideways.
You can get better results by applying different money management strategies and different entry / stop / target combos…
But, you will never see that “holy grail” equity curve in your back testing results while testing a candlestick pattern as sole trade trigger.
The same price action trading signal might pop up twice (like a rejection candle) – one rejection candle will pack a lot of value, and be an excellent trade opportunity… the other an obvious steaming pile of poo.
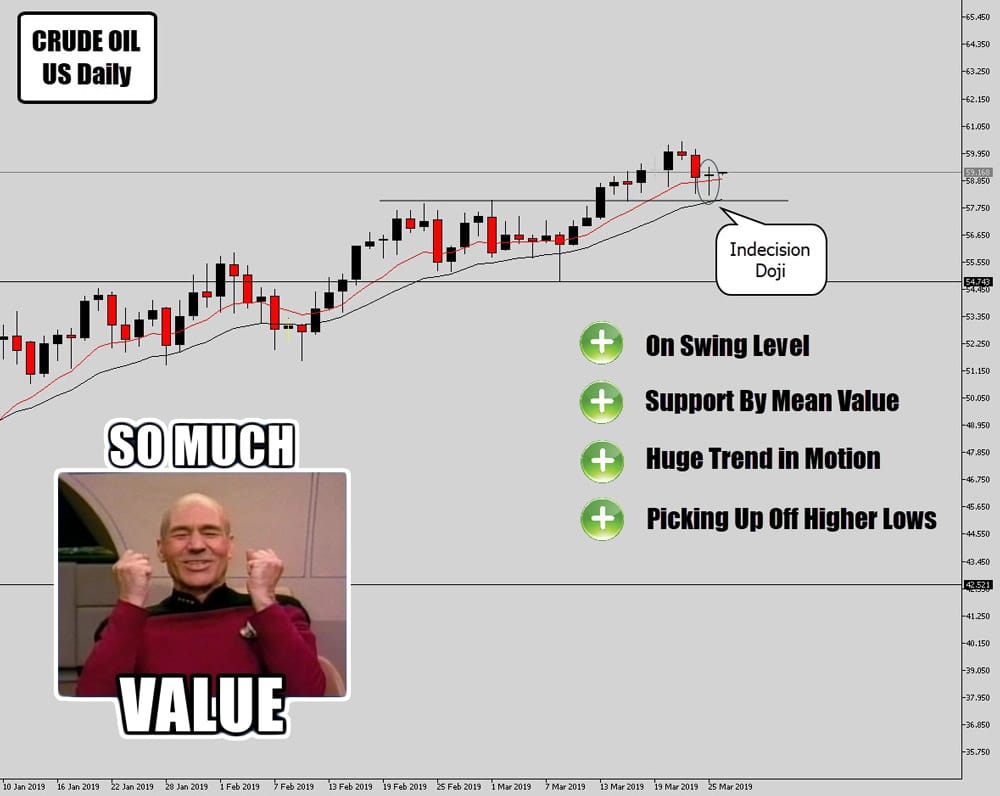
Here is an example of a price action trade with some value…
We’re not just only looking at a price action candle pattern – but a trade idea loaded with other value points…
Quality control is what’s needed, and you qualify your signals with other technical price action trading factors on chart like turning points, support resistance, price structural levels etc.
But this is no secret…
I’ve seen this preached many times, but it seems to be falling on deaf ears. Traders are still falling back to the “default” setting of: see candlestick pattern, trade candlestick pattern.
Which sets things up for a nice segway into the next tip…
Price Action Trading Tip #2: Learn to Work With Structure
Another element of price action trading that is commonly preached… but not practiced – is identifying structure with your technical analysis!
The way I approach structure is by defining and encapsulating the behavior of the current market.
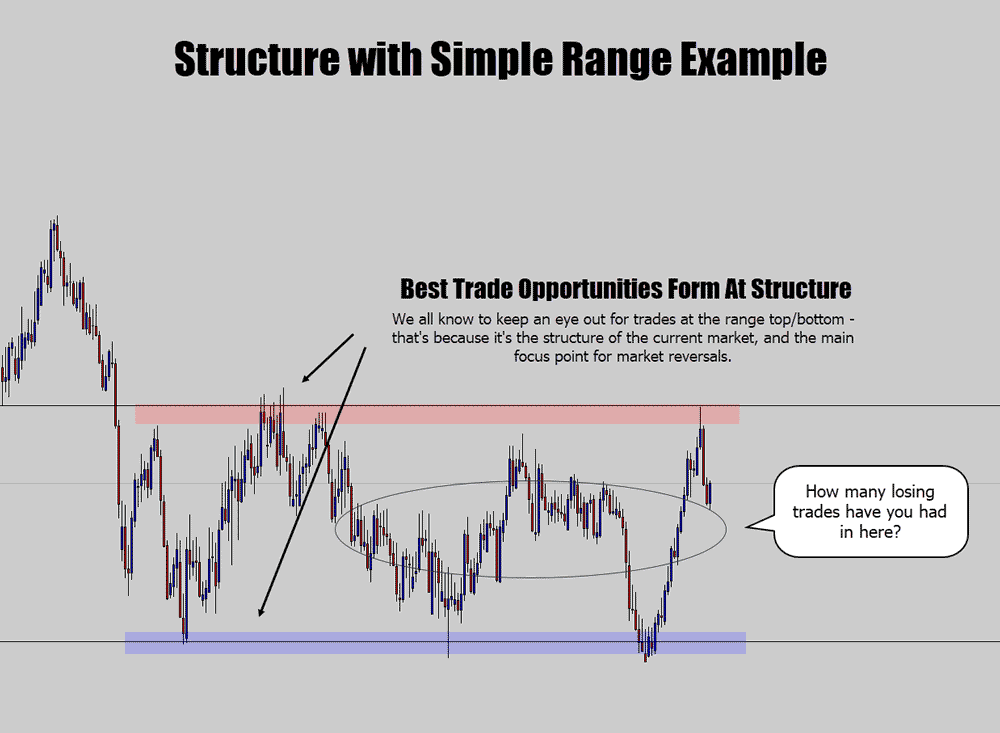
The simplest example is a range, the structure is at the top and bottom boundaries – they encapsulate the price, and this is where the best trading opportunities will appear.
Geeez this is such simple stuff, that you’re probably tired of hearing!
Just like the illustration says – I wonder if you look back through your losing trades, how many of them were taken mid range?
I would imagine a lot of losing trades pile up from taking trades “out of position” of price action trading structure.
Unless the market is blatantly consolidating in a horrible mess, usually there is some kind of structure to work within the price action.
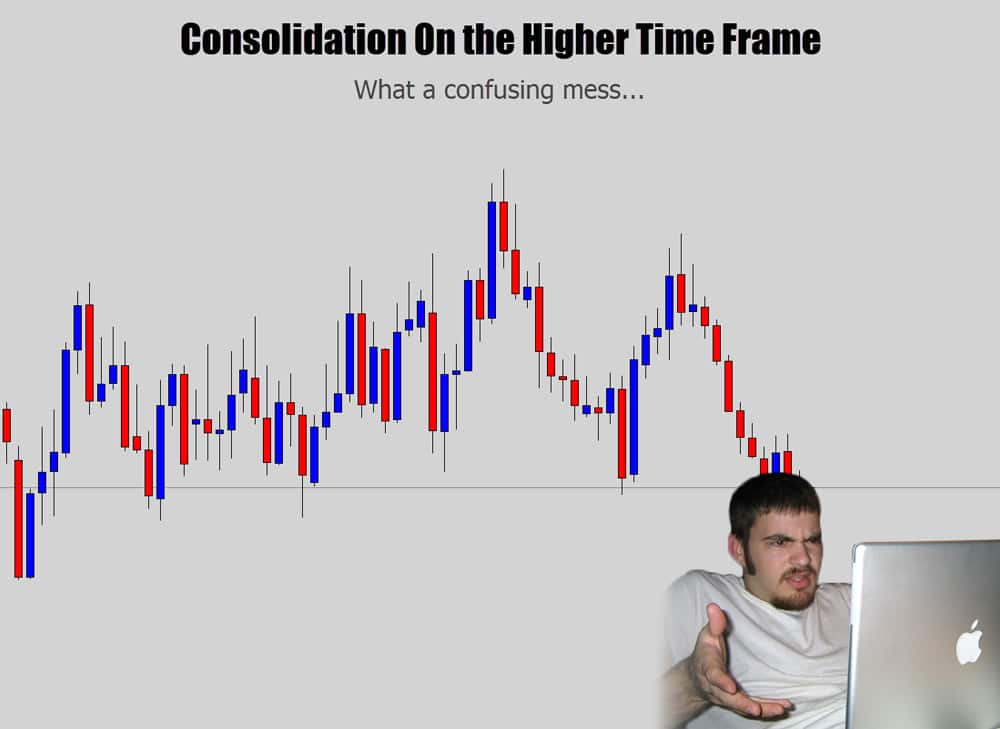
I’ve noticed sometimes higher time frame charts that look like a hot mess, like on the daily chart (where I spend most of my price action trading screen time), there is some subtle organization to it… and you can occasionally see / work with the market more clearly if there is identifiable structure there…
The daily chart above looks hostile, but sometimes if you drop down the time scale, you can see some structure you can work with, and start looking for trades!
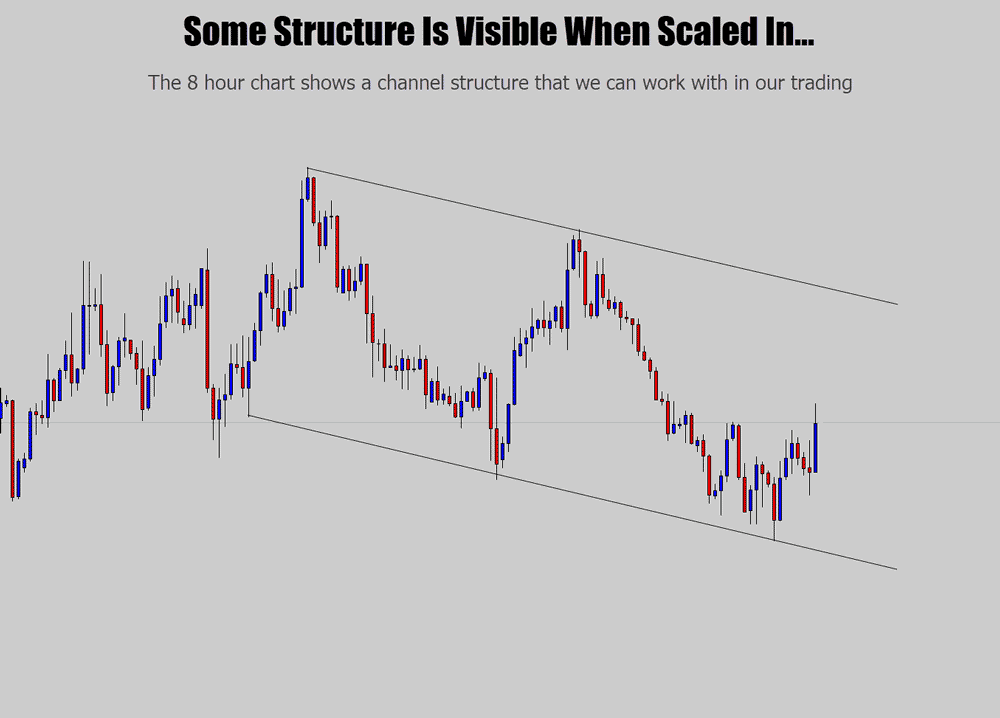
A channel that I didn’t initially make out on the daily, but stood clear on the 8 hour – now we know where to look for our high value price action trading signals!
Squeeze patterns are another structure that are often passed off as consolidation… and I guess they kinda are consolidation, but sometimes, if they are big enough, we can trade the bounces inside the structure.
So as a price action trader, market structure is really important in my opinion, and you’ve got to learn to work with it.
Generally, trader’s who I see ignoring structure, seem to be taking taking higher risk trades which are way out of position and get their stops stomped on easily.
Structure analysis is a keep it simple principle, but it helps immensely if you adopt it and punishes you if you ignore it.
Price Action Trading Tip #3: Introduce Top-Down Analysis
Some price action traders like to trade the lower time frames, usually based on the philosophy: more action = more opportunity.
Those who take it to the next level dial things up to day trading, and those traders who seek high octane trading, dive into the scalping strategies.
Both of those approaches I think are futile and psychologically damaging – most scalpers I’ve seen blow up their accounts hard and fast.
I like to use “lower” time frames to catch earlier entries on something that is aligned well on the bigger picture.
When I say lower time frame, I still refer within a swing trading context. Generally the 4 hour – 12 hour are intraday swing trading time frames…. the 1 hour can be used but only in very clear scenarios.
For example; We have a nice location on the daily chart that our technical analysis tells us is “hot real estate” to be buying from – but we don’t want to wait until the end of the daily candle to find out if a buy signal appears or not.
I drop down to the lower swing trading time frames to look for any earlier signals.
Occasionally the lower time frame will offer an early warning signal, which can allow us to build a tighter trade position around, as they generally offer tighter stops in our
Forex price action trading.
Take this NZDUSD trade for example.
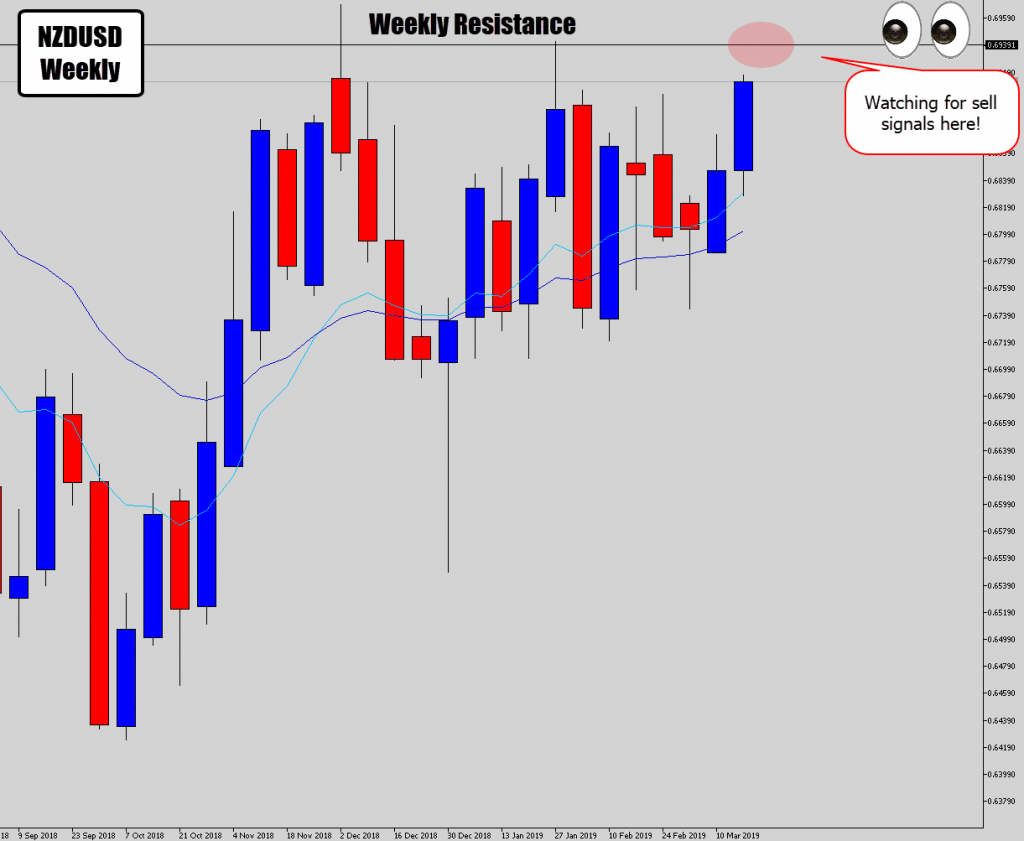
I always check the weekly charts on the weekend and include them in my weekly commentary video for my Price Action War Room.
Primarily, I am looking for those major levels where big market reversals can occur…
There is a clear weekly resistance here, where if we had seen bearish price action evidence – it would likely lead to a decent move.
Instead of waiting for something to happen on the weekly, or the daily – one of my price action trading tricks is to watch for earlier (but clear) signals to form on the intraday swing trading charts.
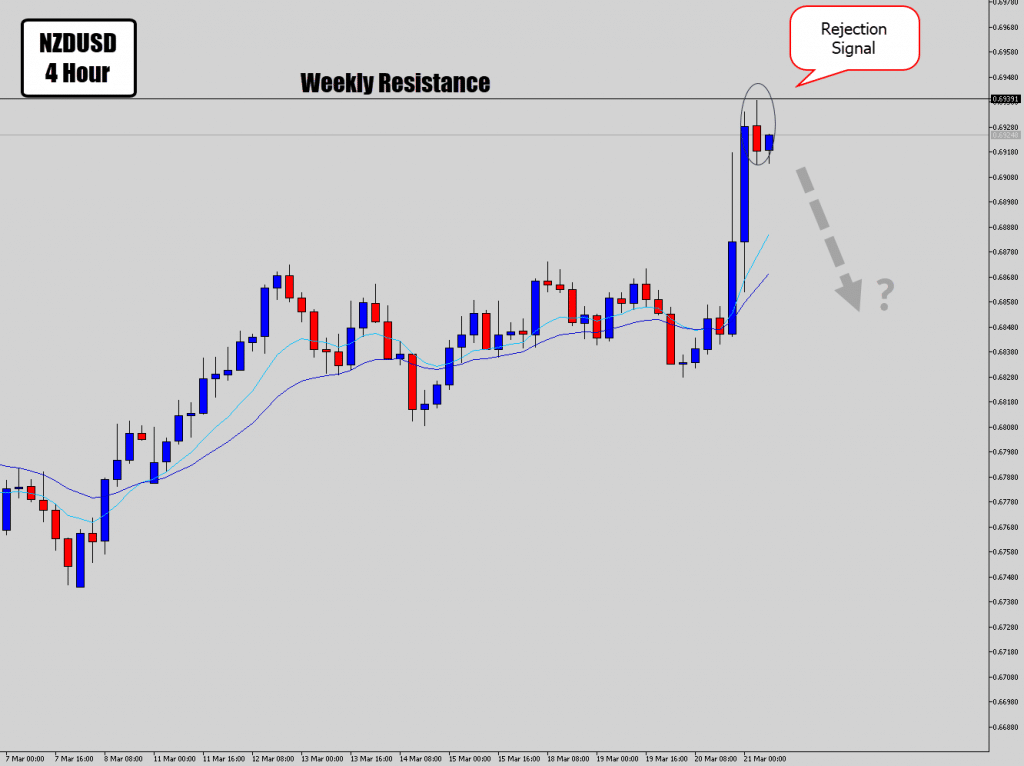
Check out what happened on the 4 hour chart…
Now the power of top-down analysis comes into play.
We know from “the top”, that we should be looking for sell signals – due to that major weekly resistance in play… something we could easily miss if we were only focused on intra day charts.
However, with that “top end” knowledge, we know where to look for bearish signals on our trading time frame.
This 4 hour price action signal has the the power of the macro behind it, and the tweaking capabilities of the micro applied to it…
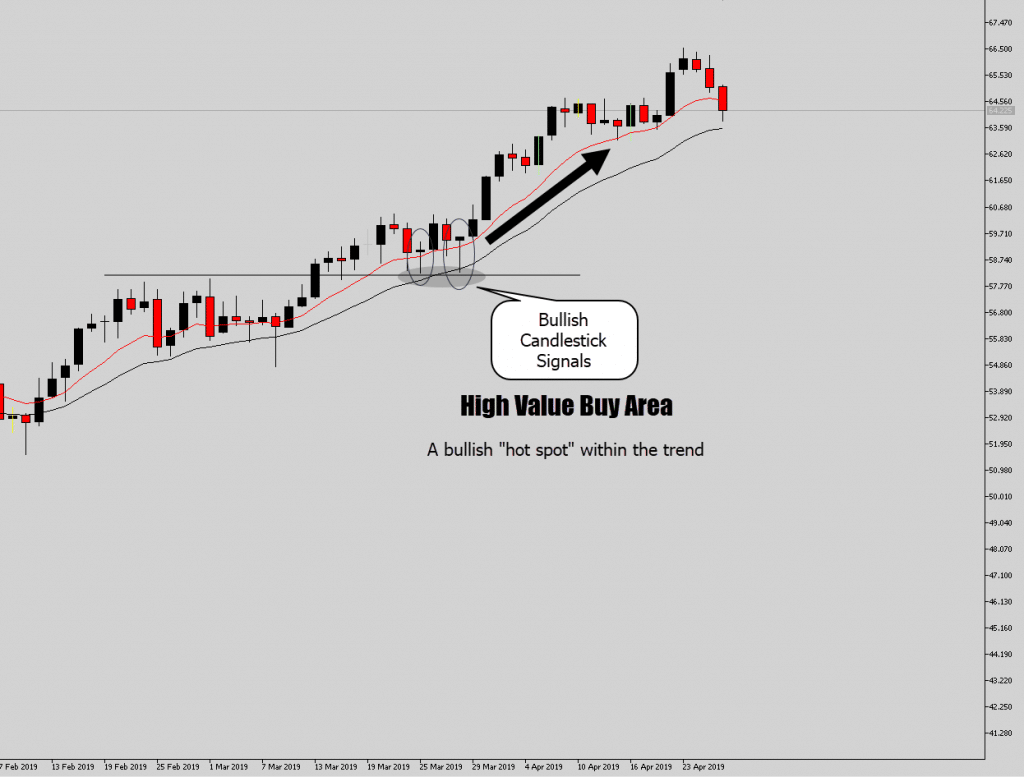
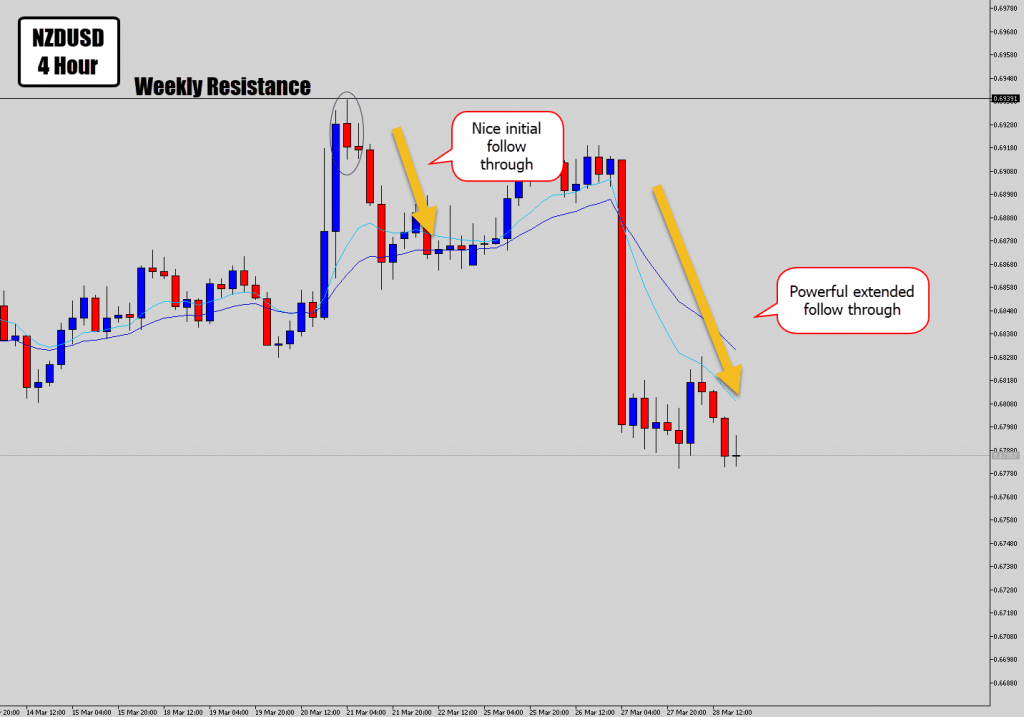
The “early warning” 4 hour signal coming off that “high value area” followed through quite nicely.
For most traders, the initial sell off probably satiated their reward criteria – but traders holding out for the larger move would have been rewarded big (not many traders can stomach holding longer term trades).
But to wrap this point up… this is scratching the surface of the advantages of top down analysis in price action trading.
There is a lot you can do with it, and you don’t have to get complicated with multi screen, multi time frame monitoring throughout the trading sessions.
Just start off with this simple “major level, trading time frame combo signal” kind of approach – it works very well.
Anchor your trade ideas to what’s happening on the larger time frames for big wins. You just have to dig deep, and find the patience to wait for the market to move into these critical macro areas, and produce signals that you’ve been waiting for.
But which markets should you watch? That slides us into the next point…
Price Action Trading Tip #4: Trade What Money Likes
There is something very important, but easily overlooked in price action trading… and that is: there always seems to be a focus “theme” across the markets.
Meaning there is almost always a “hot” group of correlated markets that are pumping easy money making opportunites with these beautiful trends they are producing.
If you’re not trading “what money likes” at the time, and getting involved with the current “hot” markets – you’re likely dealing with sideways crap.
Remember the big crypto bubble… did you trade that? I did… and that was one of the easiest and most profitable price action trading decisions I’ve ever made.
After the crypto phase died off into its “uninteresting” period, then the USD became the focus… it is where the money was flowing to. The “Trump rally” and all that hyp
But who cares what caused it, or why it is happening – we’re price action trading here… trade what you see, not what you think!
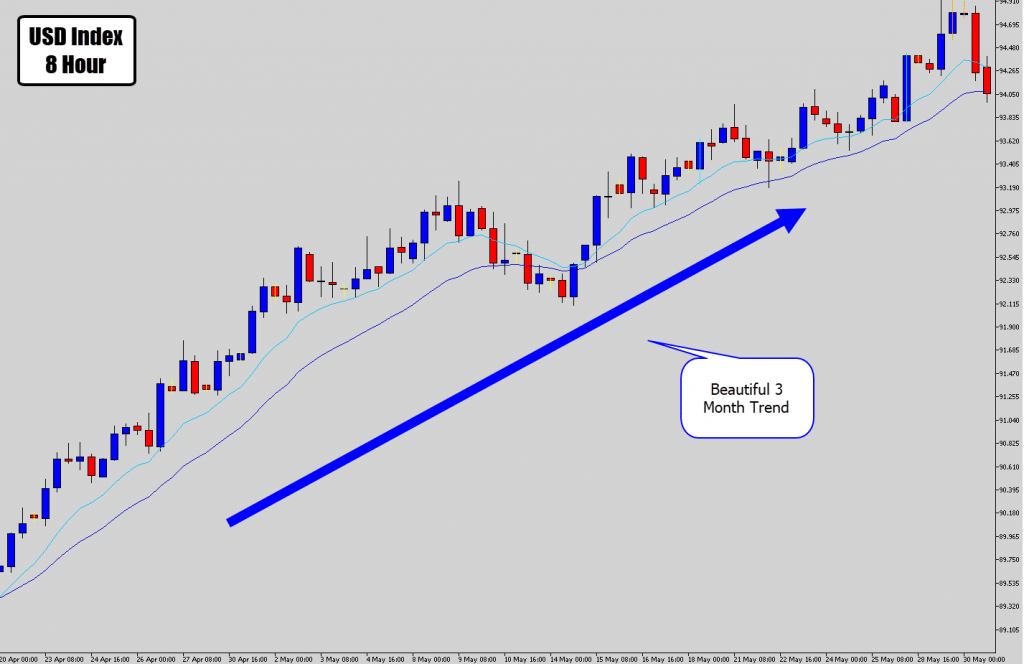
Check out the USD index rally when the US Dollar became “what money liked”…
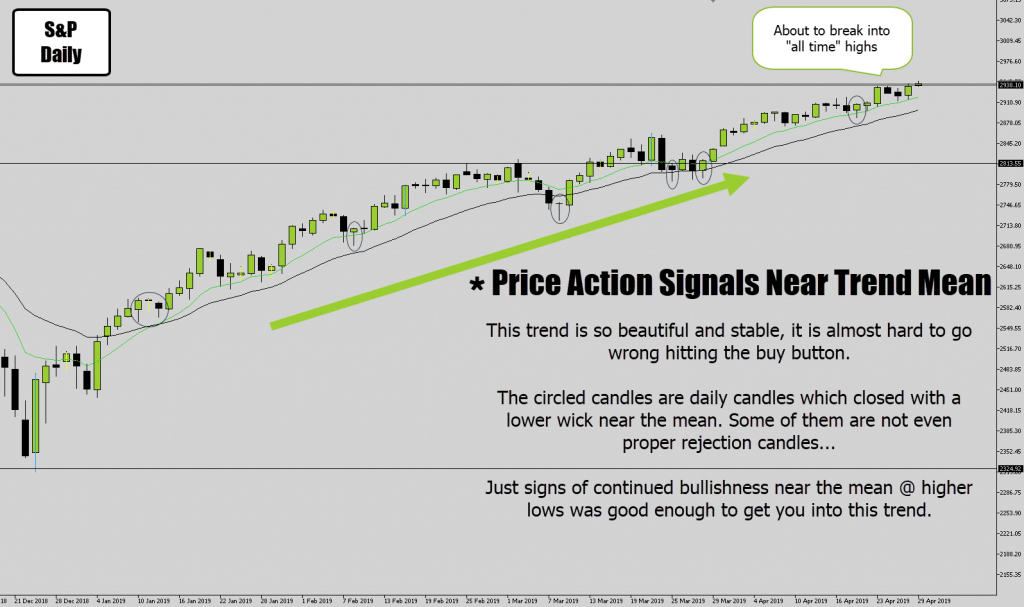
The USD Index had bursts of rallies like this one. Pretty much a buy trade at any moment on this chart would have likely made you money.
But with this “USD bull theme”, what money really liked was the US stock markets, and are the current hot markets as I write this article…
You’ve heard the saying “the trend is your friend”, well this is the context that well-known trading motto is applied to.
When these “hot” markets hit the spotlight, Forex brokers will often take them on and make them available for you to trade – since it is in their best business interests to do so… as these markets become high demand.
Take the crypto boom market phase for example – before that most brokers didn’t have bitcoin available for us common retail level traders to trade… but when Bitcoin become what money liked, all of a sudden a few crypto currencies became available with my broker for price action trading.
The point I am trying to drive home is this…
As Forex traders, you might get stuck in a mindset that you should only be owning currency markets. But the truth is currency trading has been tough the last 2 years since they have not been money’s favorite.
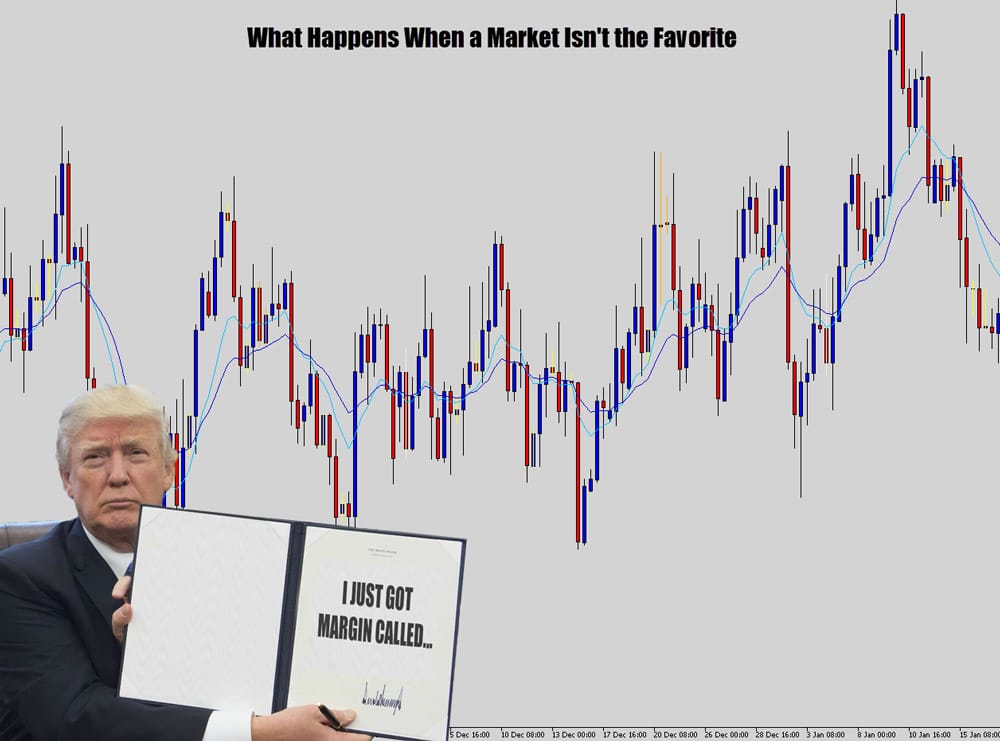
Look at the EURUSD right now…
This is the most popular currency pair, and it looks like cancer got to it… I am sure it will pick up and become the focus market again someday – but that time is not now (at the time of writing this).
Because brokers tend to offer the the markets that become popular, you should broaden your watch list. The last two years we’ve seen the attention shift from currencies towards stock indices and commodities.
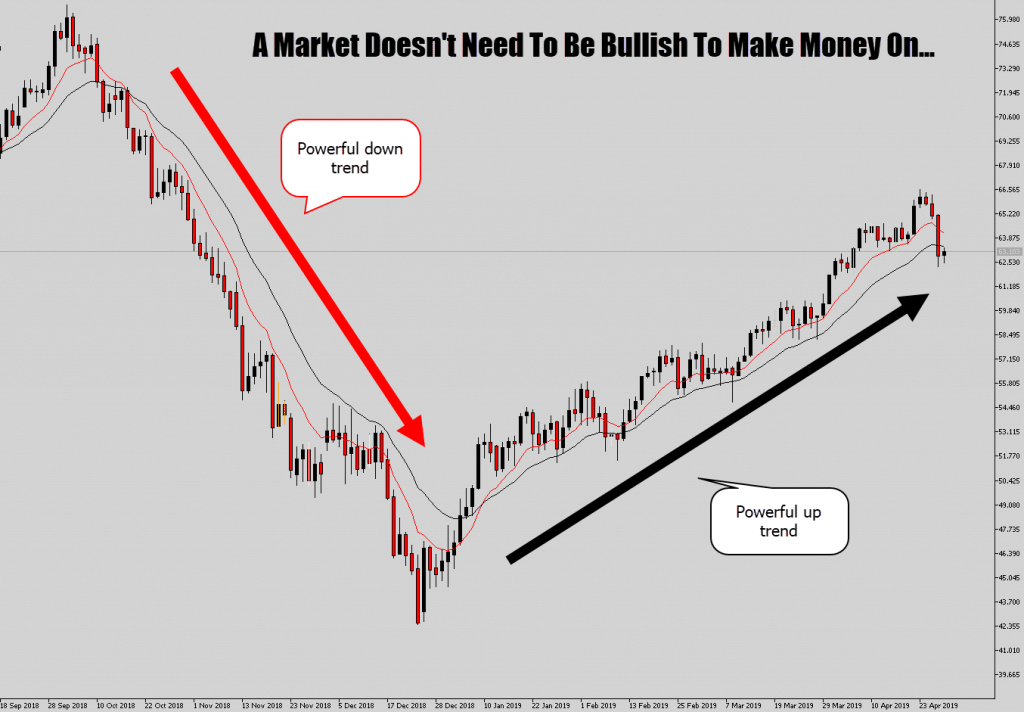
Take a look at the action on crude oil…
A market doesn’t need to be bullish to be the “hot” thing. Crude oil has been producing intense bearish and bullish trends…
But when you contrast that to the nasty EURUSD chart… it’s easy to see where the money making opportunities are.
So start looking for those “hot” markets that money likes, broaden your watch list, and try milk these existing trends to make your price action trading so much easier.
Bottom line: Stop trading SH*T markets!
Note:
Risk Disclaimer
All information is for educational purposes only. Nothing should be considered as a buy or sell recommendation. The risk of loss in trading stocks, commodity futures and options is substantial. Before trading, you should carefully consider your financial position to determine if trading is appropriate. When trading stock, futures or options, it is possible to lose more than the full value of your account. All funds committed should be risk capital. Past performance is not necessarily indicative of future results. This email may is a paid advertisement. It could be for a product or service that is not offered, recommended or endorsed by Stock Alphabets and neither the company nor its affiliates bear responsibility or control over the content of the advertisement and the product or service offered. Proceed at your own risk.
The information and material contained in these pages and the terms, conditions, and descriptions that appear are subject to change without prior notice. Investments in equity shares, debentures etc, are not obligations of or guaranteed by the Stock Alphabets, and are subject to investment risks.