This happens when the price makes lower lows, but the indicator (like the RSI or MACD) makes higher lows. This suggests that the downward momentum is weakening, and an upward reversal is likely. Traders can use this signal to enter long positions as it indicates increasing buying pressure despite the lower price lows.
Imagine the price of a stock is making consecutive lower lows, but the RSI is making higher lows. This divergence suggests that although the price is falling, the momentum behind the sell-off is decreasing, hinting at a possible upward reversal.


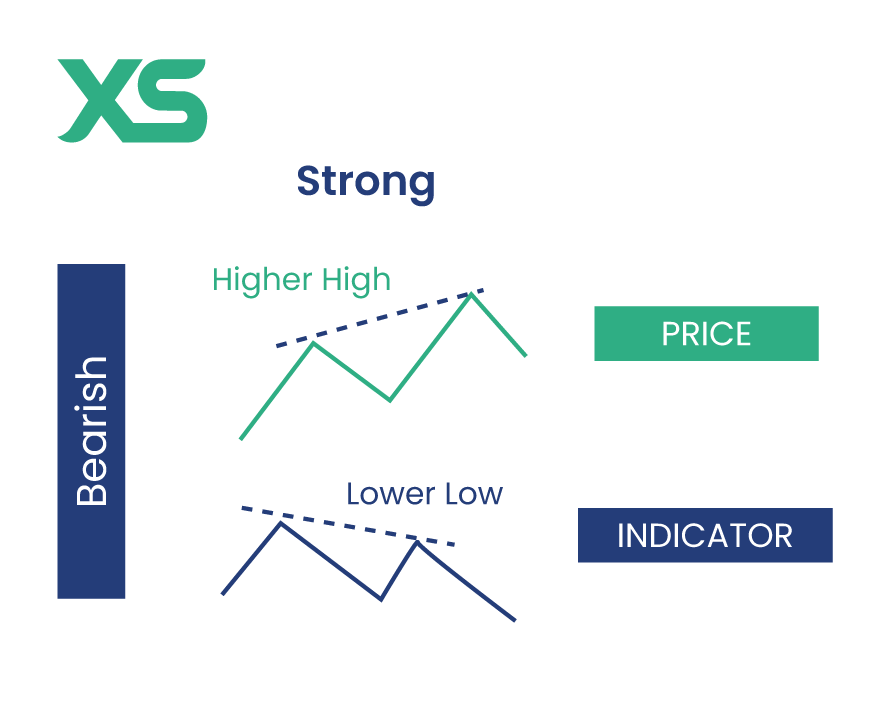
This occurs when the price makes higher highs, but the indicator makes lower highs. This signals that the upward momentum is waning, and a downward reversal could be coming.
Consider a scenario where the price of an asset is reaching new highs, but the MACD is showing lower highs. This bearish divergence indicates that the buying momentum is fading, potentially leading to a price drop.