PRICE ACTION PATTERN #2: DBHLC
- DBHLC stands for Double Bar High Lower Close and it is a bearish chart pattern which means you should be looking for this chart pattern when the market is in a downtrend.
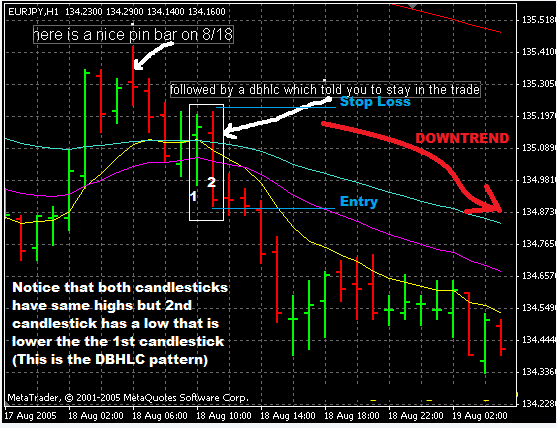
- How do you spot the DBHLC chart pattern then? Look for 2 bars that have highs that are almost on the same price level or within 2 pips of each other but the 2nd bar must have a close that is lower than that of first bar. See chart below.
- How do you trade the DBHLC pattern? There are two possible options here: sell at market order as soon as 2nd bar closes or you can place a pending sell stop order 2-3 pips below the low of the 2nd candlestick.
- For you stop loss, place it 2-3 pips above the high of the 2nd candlestick in the pattern.

0 on: "PRICE ACTION PATTERN #2: DBHLC"