Powered by Blogger.

Pages

Saturday, December 28, 2019

AB = CD Price Action Strategy

This strategy is a bit different from all the other strategies that I use. The reason is that it is based more on market psychology rather than on the institutional activity. I personally use it as a confirmation of my main (institutional and volume-based) strategies. 

Still, it is very good strategy even if you use it as a standalone strategy. The main idea behind it is that the markets move in a sort of waves. The highs/lows of those waves or swings have names (A, B, C, and D). It goes like this: 
  1. The distance from A to B is the distance from the first to the second swing point.
  2. The C is made if there is a retrace at least to 50 % to distance from AB. However, the price must not go past A. 
  3. The D is placed the same distance from C as A is from B. Because of this the pattern is called AB = CD. The leg AB has the same pip distance as the leg CD. 
  4. If it is a bullish AB = CD, then you enter a long trade at the D. If it is a bearish AB = CD, then you enter a short position at the D.
To make this more clear, here are bullish and bearish AB = CD schemes:


You can trade this setup basically on all timeframes. I look for this pattern on 30-minute or 1- hour charts, 4-hour charts, Daily charts and weekly charts. I usually don't look for this pattern on lower timeframes than 30-minute timeframes.

Best thing to measure the distances between the swing points is with the Fibonacci tool. First, you place the Fibonacci so that 0 % is at A and 100 % is at B. Then you make sure the C is more than 50 % of this distance. After that, you move the fib tool (without changing the measured distance) so the 0 % is at C. The 100 % of the Fibonacci will show you where D is (this is the place where you enter your trade).

This is how you find the D in two steps:

Step 1: Use the Fibonacci to significant swing points making A and B and finding C below 50 % (in case of a Bearish AB=CD):

Step 2: Place the 0 % to C. Don’t change the measured AB distance. This way you will find the D which is at 100 %. From this place (D) you will enter a short trade:


Here are some real trade examples of the AB = CD pattern: 

Bullish AB = CD (EUR/USD, 60-minute timeframe)


Bearish AB = CD (EUR/USD, 240-minute timeframe)


Saturday, December 14, 2019

Advanced Reversal Strategy


Alice Blue account Under me get benefit of trading use link


STEP 1 - IDENTIFY A LEVEL OF DYNAMIC SUPPORT OR RESISTANCE ON THE WEEKLY TIME FRAME:.
We start on the weekly time frame so that we know what is going on, on the big picture. Without looking at the weekly time frame you can get caught on the wrong side of the dominant trend.
 Why do we need to identify key levels of dynamic support or resistance? Because if price reacted to these level s in the past , there i s a possibility that price can react to these levels again in the future so we need to have them drawn in as a reminder once price get s to these levels again.
 After we identify and draw in our dynamic level of support or resistance, then we move to. step-2


STEP 2 - LOOK FOR PRICE ACTION PATTERNS:
Once price get s to a dynamic level of support or resistance we need to look for key price action patterns to tell us that piece is “actually reacting” to the level.
 Without price act ion patterns occurring at a dynamic level of support or resistance, this means price is disregarding the level and buyers and sellers are not taking action at the level and we do not move onto the next step without price action.
 Price action patterns we like to see: long wick candles , multiple candle rejections , momentum loss candles , patterns & shapes .
 Once we have identified a key price action pat tern at a dynamic level of support or resistance then we move onto step 3. 


STEP 3 - TIME FRAME CONFLUENCE: 
We want our directional bias on the weekly to be the same as the daily (bullish bias or bearish bias ).
 The reason for this is because if you have a short bias on the weekly, but the daily is showing bullish momentum, you have conflicting data and can get caught on the wrong side of a trade.
 We first establish our bias through looking for price action on the weekly that is either bullish or bearish, and once we have that , then we jump to the daily to see if we have a matching directional bias . 
Once we have confluent and matching directional biases on the weekly and daily, then we need to further confirm the direct ion through the 4h time frame as the daily time frame i s 24 hours worth of data per candle and we want to look deeper into the immediate trend to see a more detailed representation.


STEP 4 - INTRADAY CONFIRMATION & ENTRY:
The 4h time frame i s the key to understanding the immediate trend as it shows you exactly how price i s moving at that particular moment .
We then look for a breakout in the direct ion of our daily and weekly bias and enter with a stoploss behind some form of protect ion, such as an intraday level of support or resistance or behind a t rend line, because price can swing before i t moves in our desired direct ion and you don’t want to choke the trade and have your stoploss hit before it moves in your favour.
------------------------------------------------------

ENTRY CHECKLIST:
STEP 1 - IDENTIFY A LEVEL OF DYNAMIC SUPPORT OR RESISTANCE ON THE WEEKLY TIME FRAME:.

  • Are we at a key level of support or resistance
  • Is the level obvious ?
  • How many reject ions of this level ? ( the more the better)
  • Was it recently respected?
  • Has it acted as both support and resistance?
  • Is i t an extreme swing high or swing low? Meaning is it at the highest or lowest point price has reach in recent  time?
  • Evidently you don’t need all of the above but the more criteria you check off the better and higher quality the dynamic level is . 

STEP 2 - LOOK FOR PRICE ACTION PATTERNS:
Price action patterns to look for :
  •  Long wick candles
  •  Multiple candle
  •  rejections
  •  Momentum loss candles
  •  Patterns & shapes : triangle, wedge, double bottom, head & shoulders , etc.

STEP 3 - TIME FRAME CONFLUENCE:
To do: 
  • Check the weekly again for your directional bias (bullish or bearish)
  • Check the daily for your directional bias (bullish or bearish)
  • Is the weekly and daily directional bias the same? 
  • Only if both time frames are the same do we go to the 4h time frame

STEP 4 - INTRADAY CONFIRMATION & ENTRY:
Ask your self:
  • Ask your self:
  • What i s the directional bias we have on the 4h time frame? 
  • What price act ion pat terns do we have?
  • Does the 4h directional bias match the daily and weekly directional bias ? 
  • If all time frames are confluent look for a momentum breakout and enter 


Monday, December 9, 2019

Happy Birthday Mr. Rahulprasad Yadav


Dear Mr. Rahulprasad Yadav,

Happy Birthday! We wish you happiness, prosperity, and success for the year ahead!

On this happy occasion, why not make a vow? A vow, to Make Every Year Count. Whether it is to develop a new hobby, spending time with your family, getting fitter, or getting your finances in order; the simple thought of making each year count can go a long way for a fulfilled life.
Your every birthday is a celebration of a year that added value to your financial life.
Warm Regards,
Team Stock Alphabets

Saturday, December 7, 2019

Typical Price Action Strategy

To be clear, these are guidelines.
They help to identify specific characteristics of price patterns like the two-bar reversal. But they are by no means the only way to define two-bar reversal patterns.

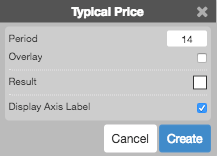
Before we start, I’ll like to introduce the concept of the typical price.
Typical price = ( H + L + C ) / 3
To find the typical price of a bar or candlestick, you take the average of its highest, lowest, and closing prices.
In the guidelines below, we’ll be relying on the typical price to find the best two-bar reversals.
Diagram notes:
  • The blue line across each bar is the typical price of that bar.
  • The background shading indicates if the bar is a trend bar.
The diagram below shows the technical considerations of a bullish two-bar reversal pattern.
(Apply the same principles to derive the guidelines for the bearish pattern.)

TECHNICAL GUIDELINES FOR THE TWO-BAR REVERSAL PATTERN

The basic form is simply two consecutive price bars that close in opposing direction.
  • Bearish two-bar reversal – One bullish bar followed by a bearish bar
  • Bullish two-bar reversal – One bearish bar followed by a bullish bar
A bullish bar closes higher than it opened. A bearish bar closes lower than it opened.
In the chart above, Bar B and Bar C form the bullish two-bar reversal pattern.
To identify the two-bar reversals that stick out:
  • The typical price of Bar B must be below the low of Bar A.
To find strength in both directions:
  • Bar B and Bar C must be trend bars. 
To ensure sufficient bar overlap:
  • The typical price of Bar B must be within the range of Bar C.
  • The typical price of Bar C must be within the range of Bar B.
Make sure you understand these guidelines before reviewing the examples below.
In the examples that follow, we will be pointing out the patterns that conform to these guidelines. We will also discuss why those that do not fit might also offer reasonable trades.

HOW TO ENTER THE MARKET WITH THE TWO-BAR REVERSAL

There are two common ways to enter the market with a two-bar reversal:
  • Enter once the pattern completes (i.e., at the close of Bar C)
  • Enter when the market breaks out of the setup bar (Bar C)
In the examples below, we will use the more conservative option – the breakout method.

TRADING EXAMPLES

For better learning visuals, I’ve included the typical price of each bar in the examples below. (blue lines)
In the charts below, all references to two-bar reversals point at the second (final) bar of the pattern.

EXAMPLE #1: 

The chart below shows the market rising in a new bull trend.

  1. This two-bar reversal pattern bounced off the new bull trend line. It was also the second test of the bottom of the circled gap area. With the confluence of two support devices, it was a reliable setup.
  2. Look at this earlier two-bar reversal price pattern.
  3. Its form is inferior to the pattern in Point #1 above. This is because it does not stick out as much. (Notice how the typical price here was not below the low of the preceding bar.)
Nonetheless, it was a reasonable trade as it found support from a congestion zone.

EXAMPLE #2: 

You can find the two-bar reversal pattern in almost all time frames.

  1. Look at this two-bar reversal. Given that the market action has been drifting sideways at that point, it was not an ideal setup. However, its success in pushing the market down confirmed the start of a fresh bear trend.
  2. We connected the highest pivot in this chart with this new swing pivot to form a bear trend line.
  3. This two-bar reversal pattern was exceptional. It found resistance at the bear trend line. And it ended with a downwards outside bar, which affirmed the bearish strength.
(Note to course students: It was also a bearish congestion breakout setup.)

EXAMPLE #3: 

Our technical definition for two-bar reversals gives us a good starting point. But we should not be too hung up on the exact form of the pattern.
This example shows two patterns. The first one fits our definition, and the second one is a borderline case.
At the end of this example, you’ll find that choosing the superior setup is not so straightforward.


  1. This two-bar reversal pattern fitted our definition nicely.
  2. This instance was a borderline case.
  3. According to our rules, the typical price of the first bar of the two-bar reversal must be higher than the high of the previous bar. Here, the typical price was merely at the previous bar high.
Hence, you might conclude that the first pattern was superior.
But let us recall the rationale for this rule. It is to ensure that the pattern is not within a congestion area and that it juts out of earlier price action.
The first pattern in the example pushed above the preceding two bars.
The second pattern above pushed above the preceding five bars.
From this perspective, the second pattern did an excellent job of “sticking out” from surrounding price action.
Also, traders new to price action trading tend to assume that definitions are rigid and distinct. With some experience, you’ll soon learn that price patterns are always in shades of gray. Overlaps are commonplace.
For instance, the second two-bar reversal here is also an outside bar breakout failure.

CONCLUSION – Typical Price Action TRADING GUIDE

The two-bar reversal is a classic trading pattern. Combine it with support and resistance, and you have a sound basis for a price action strategy.
Using the typical price measure, we proposed a definition for the best two-bar reversals.
(You can design such guidelines for other price patterns too. Use the typical price as a way to define otherwise vague price action concepts.)
But in the examples, we pointed out patterns that do not fit our description. Some were valid and profitable too.

TYPICAL PRICE

The Typical Price indicator takes the simple average between the close, high, and low prices.
Selecting the Typical Price indicator allows you to set the Period (as number of minutes), whether the indicator displays as an Overlay on the chart, and the color of the result.

Configuration Options

  • Period: Number of bars to use in the calculations.
  • Overlay: Whether to display the curve on top of the graph instead of below the graph.
  • Color Selectors: Colors to use for graph elements.
  • Display Axis Label: Whether to display the most recent value on the Y axis.

Formula

The Typical Price indicator adds the high, low, and close prices. The total is then averaged (i.e., divided by a factor of 3).
TP=Close+High+Low3


Tuesday, December 3, 2019

Account Opening Link

Account Under me get benefit of trading use link below mentioned link
---------------------------------------------------------------------------------------------------------------------------------------------------------
πŸ‘‡ Register now & open account for Upstox πŸ‘‡

πŸ‘‡ Register now & open account for Alice BlueπŸ‘‡

  • Premium call freeπŸ„‍♂
  • Free investment callπŸ†
  • Free Paid Video strategy🧘‍♀
🏌️‍♂️ Trading Masterclass πŸŒ️‍♀️
πŸ”Š Price :₹10k

THIS IS EVERYTHING YOU NEED, PERIOD.
WHAT'S INCLUDED:

πŸ—³ 96 Trading Lessons (& Growing):
πŸŽ₯ 38 In-Depth Premium Trading Videos (& Growing):
πŸ“ˆAdvanced Price Action Techniques:
πŸ”‘ Key Swing Trading Strategies:
πŸ— Key Intraday Trading Strategies:
---------------------------------------------------
πŸ“©Get in touchπŸ“©

⚡️ Click &  join group


Risk Disclaimer

All information is for educational purposes only. Nothing should be considered as a buy or sell recommendation. The risk of loss in trading stocks, commodity futures and options is substantial. Before trading, you should carefully consider your financial position to determine if trading is appropriate. When trading stock, futures or options, it is possible to lose more than the full value of your account. All funds committed should be risk capital. Past performance is not necessarily indicative of future results. This email may is a paid advertisement. It could be for a product or service that is not offered, recommended or endorsed by Stock Alphabets and neither the company nor its affiliates bear responsibility or control over the content of the advertisement and the product or service offered. Proceed at your own risk.
The information and material contained in these pages and the terms, conditions, and descriptions that appear are subject to change without prior notice. Investments in equity shares, debentures etc, are not obligations of or guaranteed by the Stock Alphabets, and are subject to investment risks.